Eight years! Wow.
In late 2013 I walked out of an office for the last time where I had been working for AHL, a large systematic futures trading fund. A few months later, in April 2014, I had my own very small systematic futures trading account, and I started doing these performance reviews. And this is my eighth review. Double wow!
As usual these cover the UK tax year, in this case from April 6th 2021 to April 5th 2022.
TLDR:
Great futures trading, no thanks to 'Black Friday', mostly thanks to the energy crisis. Outperformed AHL, but a little short of the wider index. Poor stock selection and country allocation; better in bonds; good asset allocation. Net-net: 8.2% vs my benchmark +3.8%
Overview of my world
I promised last year I would simplify things, and I have. My investments fall into the following categories:
Investing:
- 1 UK stocks
- 2 Various stock ETFs
- 3 Various bond ETFs
- 4 A small amount of uninvested cash
- 5 Futures contracts traded by my fully automated trading strategy
- 6 Cash as trading capital for the above, of which usually around a third is required for initial margin
- My house
- A cash buffer I keep to cover living expenses
- A: UK single stocks
- Benchmarked against ISF, a cheap FTSE 100 ETF (FTSE 350 is probably a better benchmark but these ETFs tend to be more expensive).
- B: Long only stocks investments: All stock ETFs and UK stocks
- Benchmarked against a cheap global equity fund (VEVE)
- C: Long only bond investments: All bond ETFs
- Benchmarked against a cheap global bond fund (AGGG)
- D: Long only investments: All UK stocks, bond ETFs and stock ETFs
- Benchmarked against a cheap 80:20 fund.
- E: Futures trading: Return from the futures contracts traded by my fully automated system. The denominator of performance here is the notional capital at risk in my account (usually close to, but not exactly the same as the account value).
- Benchmarks are a similar fund run by my ex employers AHL, and the SG CTA index, adjusted for volatility.
- F: Everything: Long only investments, plus futures hedge, plus futures trading. I include the value of any cash included in my trading or investment accounts, since if I wasn't trading I could invest this.
- For the benchmark I use a cheap 60:40 fund.
Performance contribution
The figures shown are the contribution of each category to my total investment performance:
1) UK equities 1.8%
2) Stock ETFs 2.6%
3) Long only bonds 0.07%
5) Futures trading 3.7%
4 & 6) Cash 0.0%
F) Total +8.2%
Here is another way of putting it:
Long only MTM (mark to market): 1.2%
Stock and ETF dividends: 3.2%
Futures: 3.7%
Now for the same figures as 'internal rates of return', which are effectively for the 'capital' employed in each area. I use the Excel function XIRR. You can't add these up, but they are comparable and account for flows between categories. Benchmarks are also shown.
A) UK equities +9.8% Benchmark +16.6%
B) Long only stocks +6.1% Benchmark +12%
C) Long only bonds 1.5% Benchmark -3.0%
D) Long only investments 5.9% Benchmark +7.9%
E) Systematic futures trading 27.0% Benchmarks -4.9% +32.3% (vol matched)
F) Everything +8.2% Benchmark+3.8%
I have colour coded these to give an indication of where the good, bad and unsure are.
UK equities
This portfolio is traded using a system which I've explained before (value bias, with trailing stop of 30%), but which is not automated. Instead I have the stocks set up in a spreadsheet, with alerts reminding me when stop losses occur. If I sell then I download some data to pick the best value share.
The current portfolio looks like this:
Hammerson PLC (LSE:HMSO) 0.21%
Babcock International Group PLC (LSE:BAB) 2.45%
Greencoat UK Wind (LSE:UKW) 2.60%
Imperial Brands PLC (LSE:IMB) 3.17%
Johnson Matthey PLC (LSE:JMAT) 3.24%
Morgan Advanced Materials PLC (LSE:MGAM) 3.47%
Castings PLC (LSE:CGS) 3.50%
Barratt Developments PLC (LSE:BDEV) 3.53%
Phoenix Group Holdings PLC (LSE:PHNX) 3.64%
Lloyds Banking Group PLC (LSE:LLOY) 3.75%
BT Group PLC (LSE:BT.A) 3.82%
TP ICAP GROUP PLC (LSE:TCAP) 3.96%
Centamin PLC (LSE:CEY) 4.05%
Renewables Infrastructure Grp (LSE:TRIG) 4.24%
Greencore Group PLC 4.33%
Redde Northgate PLC (LSE:REDD) 4.39%
Aviva PLC (LSE:AV.) 4.46%
Rathbones Group Plc 4.49%
Central Asia Metals PLC (LSE:CAML) 4.58%
Morgan Sindall Group PLC (LSE:MGNS) 4.89%
Centrica PLC (LSE:CNA) 5.30%
Direct Line Insurance Group PLC (LSE:DLG) 5.87%
Investec PLC (LSE:INVP) 16.05%
Most of these were bought 'normally', but I bought a double dose of Investec last year as it was a screaming buy at a time when nothing else passed my filters (this was a good decision - see below). All are above their stops except Hammerson, which was the first share I bought coming out of the 2020 COVID market pandemic: too early as it turns out. It completely cratered before I could activate the stop and now I keep it as an out of the money call option on UK property or sentimental reminder of the importance of stops - take your pick.
Here is the performance of every share I held over the year. Percentages are taken from the start of year price, or from when I bought it during the year:
MTM % Divi % TR %
Investec PLC (LSE:INVP) 138.2% 8.3% 146.5% HELD LEGACY
Morrisons (LSE:MRW) 62.7% 2.8% 65.5% SOLD LEGACY
Morgan Sindall Group PLC (LSE:MGNS) 33.5% 4.0% 37.4% HELD LEGACY
Babcock International Group PLC (LSE:BAB) 36.5% 0.0% 36.5% HELD LEGACY
Greencoat UK Wind (LSE:UKW) 20.2% 5.5% 25.7% HELD LEGACY
Rathbones Group Plc 19.6% 4.2% 23.8% HELD LEGACY
Imperial Brands PLC (LSE:IMB) 11.5% 9.3% 20.8% HELD LEGACY
BT Group PLC (LSE:BT.A) 17.8% 1.5% 19.2% HELD LEGACY
Aviva PLC (LSE:AV.) 7.5% 5.2% 12.7% HELD LEGACY
Lloyds Banking Group PLC (LSE:LLOY) 8.1% 2.9% 11.0% HELD LEGACY
Senior (LSE:SNR) 10.5% 0.0% 10.5% SOLD LEGACY
Marks And Spencer Group Plc (LSE:MKS) 8.9% 0.0% 8.9% SOLD LEGACY
Central Asia Metals PLC (LSE:CAML) 8.8% 0.0% 8.8% HELD BOUGHT
Redde Northgate PLC (LSE:REDD) 4.3% 1.5% 5.7% HELD BOUGHT
Johnson Matthey PLC (LSE:JMAT) 1.1% 0.0% 1.1% HELD BOUGHT
Renewables Infrastructure Grp (LSE:TRIG) -0.5% 1.2% 0.8% HELD BOUGHT
Phoenix Group Holdings PLC (LSE:PHNX) 0.6% 0.0% 0.6% HELD BOUGHT
Centrica PLC (LSE:CNA) 0.0% 0.0% 0.0% HELD LEGACY
Hammerson PLC (LSE:HMSO) -2.5% 1.2% -1.3% HELD LEGACY
Morgan Advanced Materials PLC (LSE:MGAM) -3.5% 2.1% -1.4% HELD LEGACY
Centamin PLC (LSE:CEY) -3.9% 0.0% -3.9% HELD BOUGHT
TP ICAP GROUP PLC (LSE:TCAP) -6.8% 0.0% -6.8% HELD BOUGHT
Direct Line Insurance Group PLC (LSE:DLG) -14.3% 4.5% -9.8% HELD LEGACY
Royal Mail Plc (LSE:RMG) -13.5% 2.1% -11.5% SOLD LEGACY
Synthomer Plc (LSE:SYNT) -16.4% 3.7% -12.7% SOLD LEGACY
Barratt Developments PLC (LSE:BDEV) -12.8% 0.0% -12.8% HELD BOUGHT
Castings PLC (LSE:CGS) -17.3% 1.0% -16.3% HELD BOUGHT
Greencore Group PLC -18.2% 0.0% -18.2% HELD LEGACY
Crest Nicholson Holdings Plc (LSE:CRST) -21.0% 1.0% -20.0% SOLD LEGACY
Micro Focus International Plc (LSE:MCRO) -27.6% 3.2% -24.5% SOLD LEGACY
Vesuvius Plc (LSE:VSVS) -29.0% 3.8% -25.2% SOLD LEGACY
Currys Plc (LSE:DC.) -28.4% 2.8% -25.6% SOLD LEGACY
ITV PLC (LSE:ITV) -31.3% 0.0% -31.3% SOLD LEGACY
Go-Ahead group (LSE:GOOG) -34.5% 0.0% -34.5% SOLD LEGACY
Let me explain the columns: MTM is mark to market (the % price change since I bought it, or the start of the year), Divi(dend)% is self explanatory, TR is total return - the sum of the first two columns. The next column describes the current state of this position: do I still HOLD or have I SOLD. The final column shows when I obtained the position: at the start of the year (LEGACY) or it's something I subsequently BOUGHT.
Of course there is a bias towards selling shares that have gone down, because of the effect of the stop loss. Morrisons is an obvious exception; I sold it in October because it was being taken over and I didn't want to wait for the cash to arrive - I actually got a small premium above the final takeover price so that was a nice fluke.
I did 21 trades in this portfolio last year for a turnover of around 85%; i.e. my average holding period is probably around 15 months. That is pretty much what I expect to achieve, and I've calibrated my stop loss accordingly. It's certainly quieter than the frantic trading I did in 2020, which covered two of my performance years. Commissions came in at 0.035% of the initial portfolio value, and stamp duty tax was 0.125% plus a few quid in PTM levies.
Stamp duty is 0.5% on buys only, but some of my shares weren't eligible (not sure why and don't really want to find out). I could avoid this by trading CFDs, but the broker I mainly use for UK shares doesn't offer these, and I'm not sure I could do this within a tax protected wrapper (as I'm actively trading, I want to avoid capital gains tax or having my trades distorted by tax optimisation).I would have paid other taxes on dividends, but generally in this post I ignore taxes.
I don't record slippage data here, but as I'm only trading FTSE 350 stocks it won't be too bad. There were other custody charges but I will account for those later since in most of my accounts I mix UK shares and ETFs (although I've since taken steps to simplify this, so I now have a single UK shares only account).
Over the year I was a net seller of UK stocks to the tune of 6% of the starting value; this was to achieve my required regional weightings (see the next section).
This has traditionally been the best part of my portfolio on a relative basis, but all good things must come to an end, or at least pause for a while. I earned an IRR of 9.8% which would be okay except the benchmark (a UK FTSE 100 tracker, ISF) returned 16.7%. It seems to finally have been the year when the much belagaured UK market actually started to catch up.
Of that sum dividends returned 3.3% - better than the 1% of last year, but still well down from the 4.6% of the year before. Forward expectations for my current portfolio show a further improvement next year, but we shall see.
2016 - 2017 XIRR 29.2%, benchmark 22.7%
2017 - 2018 XIRR 18.3%, benchmark 2.2%
2018 - 2019 XIRR -2.3%, benchmark 7.6%
2019 - 2020 XIRR -23.1%, benchmark -24.3%
2020 - 2021 XIRR +64.3%, benchmark +24.6%
2021 - 2022 XIRR +9.8%, benchmark +16.7%
Mean Me 16.0% benchmark 8.3%
Sharpe Ratio Me 0.54 benchmark 0.45
Geometric mean Me 12.9% benchmark 6.8%
Long only Stocks
As already noted this is a new category which consists of all my stock ETFs, plus my UK shares. For consistency, although it's perhaps less meaningful, here's my current portfolio of stock ETFs:
UC07 US Dividend 0.95%
PGIT* Global Infrastructure 1.46%
HMEF EM Normal 1.58%
EQDS Europe Dividend 3.69%
VHYL Global Dividend 4.30%
IAPD Asia Dividend 5.09%
PADV Asia Dividend 7.07%
PAXG Asia Normal 8.38%
IDVY Europe Dividend 9.41%
HDLG US Dividend 12.10%
EUDV Europe Dividend 12.78%
USDV US Dividend 13.10%
SEDY EM Dividend 19.20%
(PGIT is actually a UK investment trust, but I'm treating it as a stock ETF to avoid creating a new category)
Perhaps more useful are the risk exposures by region within this sub-portfolio:
Start of year End Long term Target
Asia 12% 14% 15% 14%
EM 23% 20% 25% 28%
Europe 23% 17% 20% 18%
UK 30% 29% 25% 28%
US 12% 20% 15% 12%
Start of year and End are self explanatory, whilst Long term is the strategic allocation (see my spreadsheet). After I have snapshotted the year I rebalance the portfolio to the target level shown, taking account of tax and transfers between accounts.
Turnover on the ETF part of the portfolio was lower as I gradually rebalance according to the rules in my second book Smart Portfolios, and it came in at 30% with commisions of 0.0078%. Again I don't capture slippage here; and I will also of course be paying a management fee on my ETFs, but I try to keep this as low as possible. Incidentally a shout out to one of my brokers, iweb, who are now showing a very clear screen with all the charges you'd pay when you buy an ETF before the trade goes through.
For the stock portfolio as a whole then then the turnover was 47%, with commissions and taxes coming in at 0.06% (most of that being the pesky taxes on UK shares). Again there are other management charges at the account level, but as I have both stocks and bonds in many accounts (I do try and keep my tax sheltered accounts purely for stock ETFs for reasons explained in Smart Portfolios, but my non tax sheltered accounts have both bonds and stocks).
I was a net buyer of stocks during the year, as will become clear below, to the tune of 12% of the starting value of the portfolio.
Anyway, the XIRR for this weird stock/ETF hybrid beast is 6.1%, which isn't wonderful - in fact it's significantly less than the benchmark ETF I've chosen (VEVE) which returned 12%. Dividends were 3.9%.
Since the start of 2022 I'm seeing signs that my long run bets on value and the UK, and permanent US underweight, are starting to bear some fruit, so maybe this will look better next year.
No performance history here as this is the first time I've calculated this figure.
Long only Bonds
Another new section, this time with just ETFs. Current portfolio:
SLXX UK Corporate 8.48%
EMCP EM Corporate 9.00%
FAHY US High yield 9.15%
JNKE Europe High yield 10.31%
VSL* Global High yield 15.90%
VDET EM Government 19.80%
SHYG Europe High yield 27.36%
* VSL is actually a UK investment trust, but I'm treating it as a bond ETF to avoid creating a new category
Risk:
Start of year End Long term Target
Asia 1% 3% None 5%
EM 44% 40% 25% 27%
Europe 20% 35% 25% 24%
UK 34% 8% 25% 28%
US 2% 13% 25% 16%
Note: in previous years I've classified the 'cash like' ETF XSTR as a bond ETF. This year I've classified it as cash, which makes reporting easier and also makes more sense. The UK starting risk figure above has been recalculated to reflect this, so won't be comparable with previous years.
Note also that I don't own any Asian bond ETFs or have a long term allocation for them as there weren't any available last time I checked: the exposure shown is a 'look through' from the global bond ETFs I own.
Turnover was high in this portfolio at 178% of the average start and end value; but it's perhaps easier to point out that I was a huge net seller of bonds this year, the portfolio reducing in size by 60% (and that does not include the effect of reclassifying XSTR) which was entirely driven by net selling, not performance. Commissions were 0.044% of average capital.
The XIRR is 1.53%, which sounds mediocre until you remember we are in the middle of a massive bond bear market, and the benchmark AGGG was down -2.97%. My weighting towards corporate and high yield rather than government bonds helped here. Dividends - or rather coupons - added a massive 4.63%. A weird year when bonds, albeit risky ones, earned me more in dividends than stocks! Although the fact I was a big net seller makes this figure hard to calculate.
Again no performance history here as this is the first time I've calculated this figure.
Long only investments
Start of year End Long term Target
Bonds 13% 5% 22% 8%
Stock 87% 95% 78% 92%
Start of year End Long term Target
Bonds 8% 3% 10% 5%
Stock 92% 97% 90% 95%
Std. dev Me 18.1% benchmark 11.6%
Std. dev Me 18.1% benchmark 15.6%
Mean Me 8.5% benchmark 11.1%
Sharpe Ratio Me 0.47 benchmark 0.72
Geometric mean Me 7.2% benchmark 10.2%
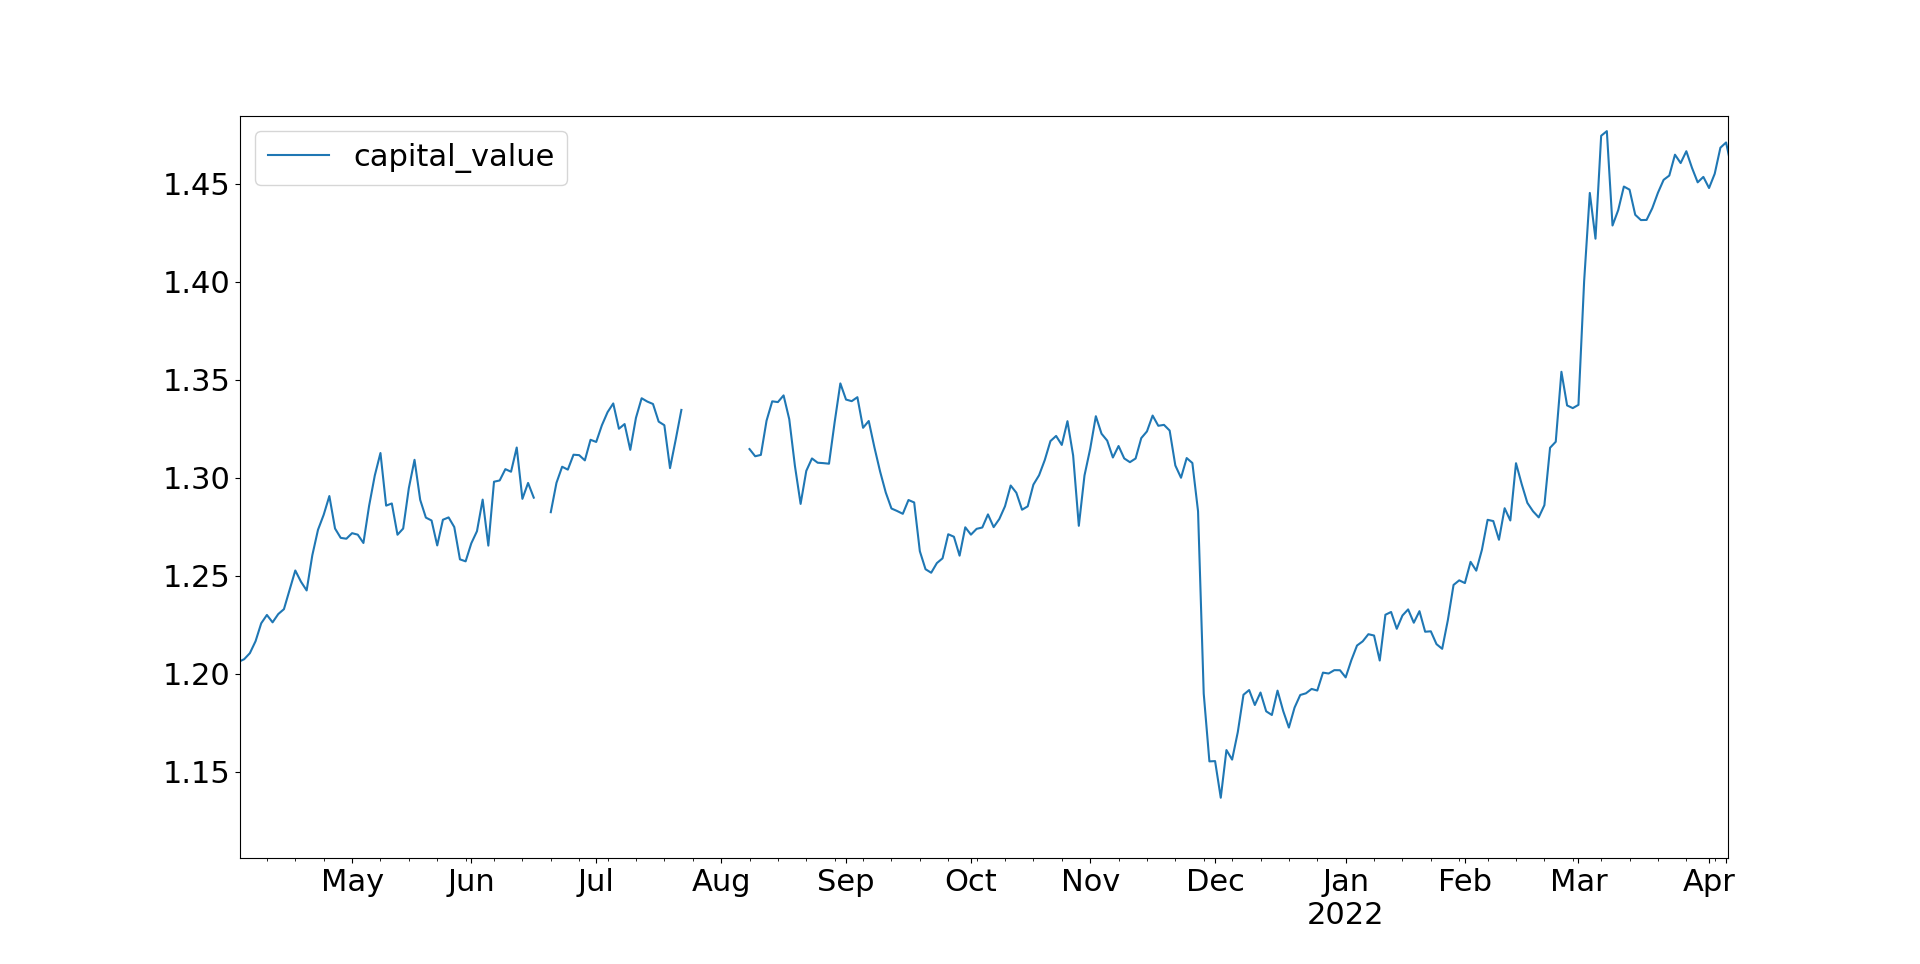
Futures trading
 |

           codes  pandl
0           PLAT   -2.7
1            AEX   -2.5
2           BUND   -1.4
3        LEANHOG   -1.3
<SNIP>67 OAT 1.0
68 SP400 1.2
69 VIX 1.5
70 SP500_micro 1.6
71 NASDAQ_micro 1.6
72 GAS_US_mini 1.6
73 JPY 1.9
74 SMI 2.2
75 SOYBEAN 2.8
76 CORN 2.8
77 BRENT-LAST 4.1
78 CRUDE_W_mini 4.9
79 HEATOIL 5.1
80 GASOILINE 5.7
Mean 17.0% 10.5% 10.0%
Sharpe ratio 0.70 0.43 0.41
Geometric mean 14.8% 8.5% 7.7%
Everything
Std. dev Me 11.7% benchmark 10.9%
Mean Me 9.1% benchmark 5.9%
Sharpe Ratio Me 0.78 benchmark 0.54
Geometric mean Me 8.6% benchmark 5.4%
Hi Rob
ReplyDeleteI really appreciate that you list all your ETF's. It has helped me a lot building my own portfolio.
I have a quick question. How is your portfolio weighted in terms of:
- UK equity
- ETF
- Futures
33% each?
Regards
UK equity as proportion of long only is easy: just multiply by equity allocation by UK regional allocation. If we use the target figures for these (as I've now rebalanced), then in cash terms its .95*.28 = 27%
DeleteSo long only is 27% UK equity, 73% ETF
I can't tell you my futures proportion, because I've said elsewhere what the size of my futures account is, and from that you could back out my total investing account size, which I'd rather you didn't.
I can tell you my futures allocation is between 1% and 50%, but that's it :-)
Thanks.
DeleteI understand.
Roughly 90:10 split between capital allocated to the long only investments and futures trading?
ReplyDeleteHi Rob,
ReplyDeleteI am following your strategy in your Smart Portfolio book. I am very surprised within your Stocks and Bond bucket, your long term target is 90% stocks and 10% bonds. I am very bearish on bonds as well, however even if have a low discretional adjustment on bond risk weight (0.65%) and pretty much no adjustment for equities, I come out as 50/50 cash weights. Did I miss something in your book?
I guess this just depends on what are your portfolio level risk targets for stocks, bonds and alternatives (where futures fits in), isn't 5% risk target very low for bonds? It would make sense for a new graduate from university ;)
DeleteWhere did you get these figures from?
DeleteCan you remind us again why your "Everything" ITD starts in 2015 while "Futures" ITD starts 2014?
ReplyDeleteI didn't start monitoring my entire portfolio in the same structured way until 2015
DeleteAh thanks. (Was trying to get a slightly longer ITD performance metric back to 2014).
DeleteBtw- the hyperlink to this page from your "systematic start here" page is broken, I only got here by clicking on "year seven" and then 'hacking' the URL to land here.
Another Q regarding sizing and capacity: I haven't seen you mention $ size in your futures trading, and I understand if it's awkward to do publicly. I'm curious what $-amount that's needed to trade the universe you're doing or to run pysystemtrade. How badly does having less $ start to limit you in terms of chunkier sizing, and how badly does having more $ start to shrink your tradable universe due to higher req for liquidity? Say for the $ ranges 100k - 300k, 300k - 600k, 600k - 1mm, 1mm - 2mm, 2mm - 5mm?
Thanks Rob
My account size is 500k. I've written about this problem extensively, https://qoppac.blogspot.com/p/systematic-trading-start-here.html search for 'Trading with a small(ish) account'
Delete