Here is part two of my annual review. Part one looked at my overall portfolio, including long only, but there was only a cursory look at my futures. Here in this second part I will be looking a my futures trading account in a lot more detail.
It's important to say why I'm doing this. I'm certainly not doing it so I can upweight good strategies, and delete badly performing ones. A year of data on top of a 50 year backtest is meaningless. But it's interesting to know what did well or badly, whether my trading costs were higher than expected, how closely my live performance matches simulation, and whether my new dynamic optimisation is adding value compared to the simpler static system I was trading until late 2021 (as requested by Christina).
A reminder of my overall futures performance
It might be interesting to look at the performance of me versus those benchmarks since I started trading my own money:
Me Bench1 Bench2
2014 – 2015 58.2% 70.2% 50.7%
2015 – 2016 23.2% -8.7% -1.6%
2016 – 2017 -14.0% -6.2% -25.5%
2017 – 2018 -3.7% 7.5% -4.4%
2018 – 2019 5.2% 8.1% 0.8%
2019 – 2020 39.7% 22.6% 9.3%
2020 – 2021 0.4% 0.8% 12.7%
2021 – 2022 27.0% -5.2% 38.3%
2022 - 2023 -8.71% 5.0% -1.30%
Mean 14.1% 10.4% 8.8%
Std dev 24.3% 24.3% 23.1%
SR 0.58 0.43 0.38
Geom mean 11.9% 8.5% 6.7%
Correlation 0.71 0.80
alpha 6.7% 6.8%
beta 0.71 0.84
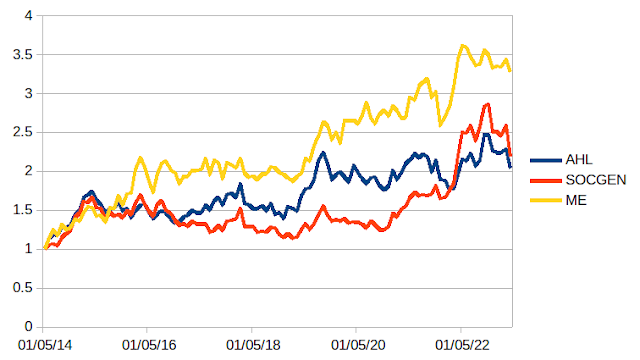
Still looks pretty healthy. I seem to have been hurt less badly by the sell off that occured in March, possibly due to a lower trend following component (more discussion of that later).
Market by market
Here are the numbers by asset class
OilGas -3.19
Ags -2.78
FX -2.00
Equity -2.14
Sector -1.64
Metals -0.94
Vol 1.52
Bond 1.56
A big turnaround for energy and ags markets, the darlings of the 2021/22 accounting period. And here are some worst and best:
0 GAS_US_mini -2.0
1 SMI -1.7
2 WHEAT -1.5
3 AUD -1.4
4 US10U -1.4
5 EU-BASIC -1.2
6 IRON -1.2
7 CRUDE_W_mini -1.2
8 SOYOIL -1.0
9 GBPEUR -1.0
....
47 US20 1.0
48 SOYMEAL 1.1
49 VIX 1.4
50 EUR 1.7
51 JPY 2.0
52 BUND 2.0
Trading rules
Presented initially without comment, a bunch of plots showing p&l for each trading rule group:


The most obvious thing is how depressingly bad all of these graphs are. Pretty much every group of trading rules had a small net loss over the year. Even the diversifying carry and skew strategies weren't much help, although they did make money back in the sell off that caught out all the trend following style rules, narrowing my underperformance against the benchmark for the year. Only mean reversion (within asset classes - basically a value strategy), and relative carry were decently profitable.
It's this lack of signal diversification that brought me to my second worst loss when I started trading: -8.7%. Of course, most equity long only managers would murder half their family for that to be their second worst annual loss, so let's get some perspective here.
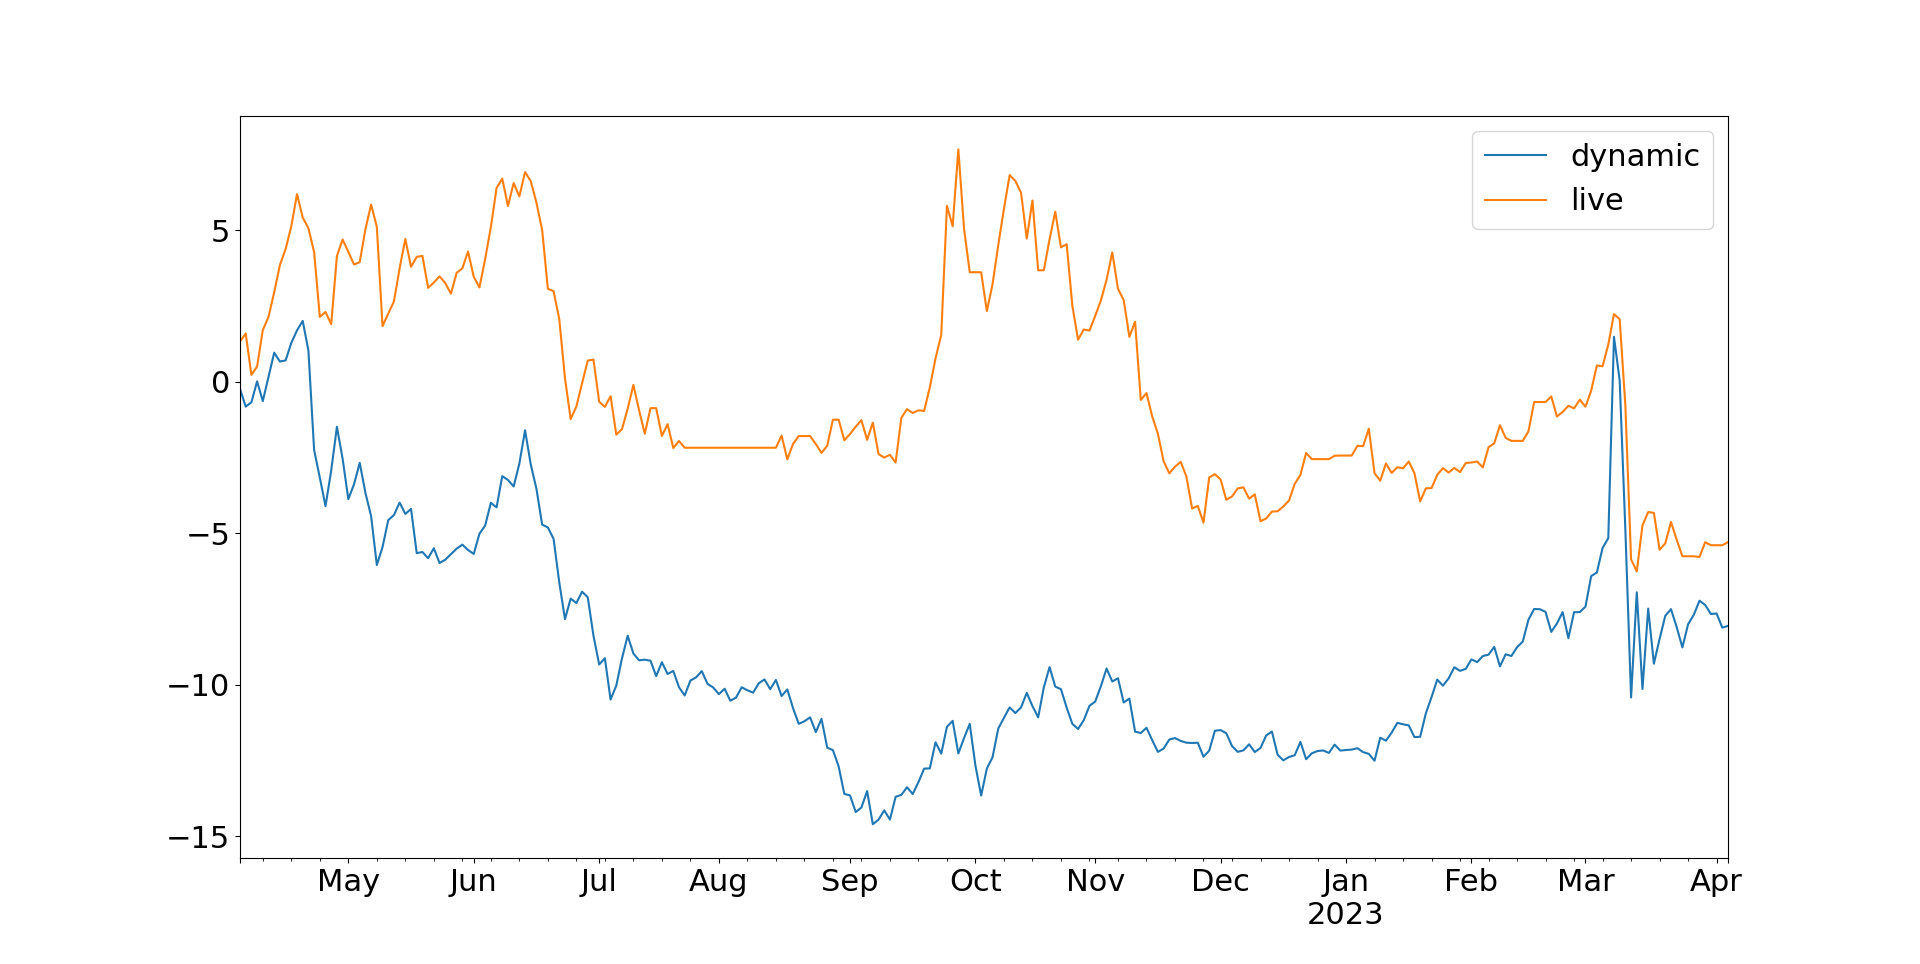
Live vs sim
Now let's turn to see how well my live performance matches what my backtest thinks I got. The dynamic optimisation introduces some new jeopardy here, since it results in some path dependence; if the starting positions are different at the start of the time period it's more likely that things will diverge thereafter (I could deal with this by populating my actual starting positions into the backtest on the first of April, but that's a lot of hassle).
Costs and slippage
I already noted above that my commission came in at 21bp (basis points = 0.21%) of account value, but how about slippage?
The cost I would have paid had I crossed the spread every time I traded (market orders) would have been 91bp. However my execution algo by sometimes executing passively saved me 22bp, i.e. around a quarter of the total. So my net slippage was 69bp, for total costs of 90bp.
This is a lot less than last years 3% (due to a one off strategy change), and a little less than my backtest which comes in at around 1% a year. It looks like my new dynamic optimisation algo is doing it's thing.
Dynamic vs static optimisation
Finally let's compare the performance of what I currently trade (dynamic optimisation with over 100 instruments) versus what I was trading before (static optimisation with less than 30). I'm going to compare backtest vs backtest here - I no longer trade static optimisation with real money so there is no other way of doing it; and it seems fairest to compare like with like. Plus we've already seen the difference between the dynamic optimisation backtest and it's live production returns.
Naturally one year doesn't prove anything, and it's also true that the results of a static backtest can be unusually flattered by getting lucky with your choice of instruments (something I discuss at length in my new book).
An important point here is that it's generally a good thing to store the code and config you use for past trading systems so you can do this exercise. It might also be worth noting down the hash number of the repo version you used with the code; firstly in case you fix bugs in the backtest that change the results (or introduce new bugs!) - although arguably if you run the same code with both backtests that is fairer; secondly in case you make changes that are backwardly incompatible and the old code just doesn't run.
First the long view (well since 2000, which is when my stored backtest begins):


What next
I'm not as interested in some of these statistics as other people are; with the exception of costs, and as long as my live p&l is in the same ball park as my backtest. But hopefully your curiosity has been sated.
My short term plan is to add another bunch of instruments to my strategy, since I've added a bunch more to my database. Then I'm going to have a look at implementing some of the novel strategies in my book, albeit with some fun twists.
Hi Rob,
ReplyDeleteI noticed that over the whole 9 years, your futures portfolio has come in at 24% annualised vol, just below your target of 25%.
I would have expected your realised vol to have come in way below your target if you're trading 100+ instruments but capping your IDM at 2.5 as in your books.
Do you not cap your IDM in your own portfolio, or is something else going on here?
Richard
I used to cap my IDM but not anymore. But this doesn't affect things as much as you think. My estimate of IDM is 2.76; so I would only have been 10% under-risked. But the 'something else going on' is that expected vol is less than realised vol it would seem. Another good reason to be conservative on risk targeting.
DeleteI want to eventually fire most of my CTA managers that would be redundant to the pysystemtrade strategies and go full DIY when I am ready. Among several considerations that gives me some minor pause is the dispersion in results. There is some comfort in an ensemble approach to reduce TE relative to an index like SG Trend or the broader CTA index, but in the end the goal is to build uncorrelated strategies with positive expected returns relative to long only market risk factors. the goal is not to track an ensemble index in and of itself. Pysystemtrade clearly does this and historically more effectively than the benchmarks burdened by fees. Your work and your willingness to share your years of experience and mastery from the high level philosophy and strategy all the way down to the granular details of execution and refinement, is unique and truly impressive. Your books, the blog, and the github for pysystemtrade are indispensable resources for those of us on the path. I hope that I can work methodically and diligently to take control of my portfolio by mastering the tools you have provided. My plan is to first fully understand the trading rules from AFTS and the tactics from Part Six. Integrate the signal generation from the trading rules with the risk sizing and other tactics to develop a mental model of execution. Backtest it myself to develop facility with the tools and data and process. I would then want to implement a manual approach and eventually automate. It's a daunting process, but certainly possible for anyone with a working understanding of modern portfolio management and its pitfalls, the futures markets, spreadsheets, a willingness to develop the coding skills (with the help of AI), and the time and energy to see it through.
ReplyDeleteI don't think I have ever come across a teaching of this scale, scope, depth, and rigor all with accessible practicality, utility and elegance in the consistency of its application, in all my years of finance. Your parents must be very proud.
Hi Rob, I know you've taken a step away from the pysystemtrade git repo, but will you continue to blog.... please.... Also, Do you plan on blogging on your results for 2024 (I think your year end reporting is usually May?) Would you consider showing a monthly breakout of pysystemtrade performance historically? I am curious how it will compare to my portfolio ensemble of CTA hedge funds with their layer of fees.
ReplyDeleteYes I am planning to publish some more blog posts, just getting my mojo back after a long summer off and getting some momentum on other projects. It is quite straightforward for me to set up a report that publishes the live account curve of my trading on a regular basis as a .csv - would that work?
Delete