Mad out there isn't it? Tarrifs on/off/on/partially off/on... USD/SP500/Gold/US10/Bitcoin all yoyoing like crazy. Seems a good moment to be slightly reflective.
I skipped my annual performance update last year, a little sad given it was my tenth anniversary. Mainly this is because it had become a lot of work, covering my entire portfolio. The long only stuff is especially hard, as all my analysis is driven by spreadsheets rather than nicely outputted from python. If I'm going to restart the annual performance, I'm going to do it just on my systematic futures portfolio. That's probably what most people are interested in anyway.
This then is my 2025 performance update. As in previous years I track the UK tax year, which finishes on 5th April. That precise dating is especially important this year!!
You can track my performance in (almost) real time, along with other information here,
TLDR: On a relative basis my performance was good, 3% long only vs -0.1% vs benchmark; -16.3% in futures vs ~-18% benchmarks. On an absolute basis, it's a mediocre year long only and my worst ever in futures.
Headline
My total portfolio performance was -1.9% last year; It would have been +3% without futures. That's a sign that this hasn't been a great year in the systematic world of futures trading. Spoiler alert - it's my worst ever. Whilst I'm not doing the full gamut of benchmarking this year, my benchmark of Vanguard 80:20 was down 0.1% (thanks to Trump), so I would have been well ahead of that if it wasn't for futures.
Everything else in this post just relates to futures.
Headline numbers, as a % of the starting capital:
MTM - mark to market - also includes gains or losses on FX positions held to meet margin, and on the cash like ETFs. Broken down:
Pure futures: -14.5%
Cash like ETFs: -0.64%
FX: -2.7%
So perhaps a better way of doing this would be to lump together all the interest, margin and ETF related flows, and call those 'cost of margin':
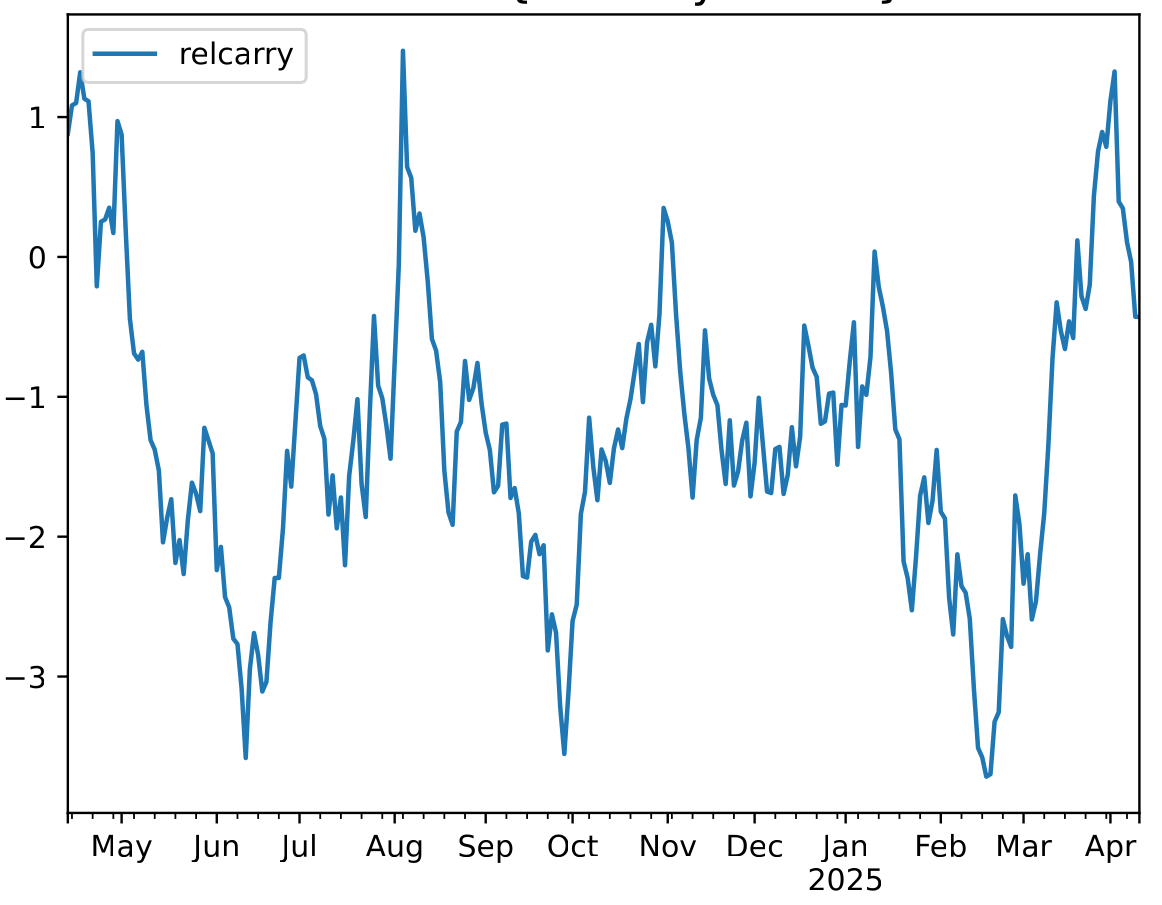
Time series

You can see that after the peak in late April (which was also my all time HWM), we have two legs down; the first is almost recovered from; but the drawdown from mid July to the end of September is quite vicous at ~17% is probably the worst I have seen.
Just about visible at the end of the chart is 'tariff liberation day' which has liberated me from a chunk of my money. Ouch, let's make ourselves feel better with a longer term plot

Benchmarks
My two benchmarks are the SG CTA index, and an AHL fund which like me is denominated in GBP.
Here is the raw performance:

AHL SG ROB
Mean 4.5% 4.0% 12.9%
Stdev 10.7% 8.9% 16.8%
SR (rf=0) 0.42 0.45 0.76
Those Sharpes would be lower, especially in the last couple of years, if a risk free rate was deducted.
My correlation is 0.66 with SG CTA, and 0.56 with AHL. Their joint correlation is 0.78. Perhaps because I'm not just trend following and carry. Both have been bad this year. More on that story later. To make things fairer then, let's do an insample vol adjustment so everything has the same vol:

I'm still winning, but it's a bit closer. Here are the annual figures:
AHL SG Me
30/03/15 66.0% 51.4% 59.5%
30/03/16 -6.2% -3.7% 28.1%
30/03/17 -3.7% -12.6% 2.4%
30/03/18 8.7% -1.7% 2.0%
30/03/19 5.4% -2.7% 4.5%
30/03/20 22.0% 6.5% 33.8%
30/03/21 0.9% 11.9% -1.7%
30/03/22 -12.0% 33.1% 25.8%
30/03/23 8.3% 0.6% -7.6%
30/03/24 14.5% 24.3% 20.6%
30/04/25 -18.2% -17.9% -14.7%
I've highlighted in green the best performer in each year, red is the worst. You can see that, at least with my vol adjustment, it was a shocking year for the industry generally, and although this was my worst year on record, I did actually outperform (the unadjusted numbers are -12% for AHL and -10% for the CTA index so I was worse than those, but obviously would have looked even better earlier in the period).
The one stat I haven't included here is my favourite, geometric return or CAGR; mine was 12.0% vs 5.9% AHL and 6.4% SG (based on the leveraged up, vol adjusted numbers in the second graph; the figures would be worse for AHL and SG without this adjustment).
Is this fair? Well no, there are fees embedded in the AHL and SG numbers. My fees aren't in these figures, and are much higher - I charge no management fee, but my performance fee is 100% :-)
Market by market
Here are the numbers by asset class:
When you only make money in one sector, that's a bad year! My worst markets were: Gas-pen, MIB, China A construction, Gasoline, MSCI Taiwan, Platinum, MXP; with losses between 1.7% and 1%. My best markets were Coffee, MSCI singapore, Cotton#2 and S&P 500; with gains between 1.7% and 0.7%. So no concentration issues at least.
Because of my dynamic optimisation, the p&l explanations can be ... interesting. Coffee for example, I made 1.7%, but I only held Coffee for less than two weeks; from 31st January to 11th February 2025 (a period in which it went up rather sharply as it happens, but I missed out on the long rally that preceeded it).
S&P 500 on the other hand, I actually traded:


Trading rules
Presented initially without comment, a bunch of plots showing p&l for each trading rule group (these are backtested numbers, and they are before dynamic optimisation).


What a rogues gallery! It's quicker to list the rules that did make money or at least broke even:
Costs and slippage
Without my execution algo, if I had just traded at the market, I would have paid 1.53% in slippage; my simple algo earned 97bp and cut my slippage bill by two thirds. So that is a good thing.